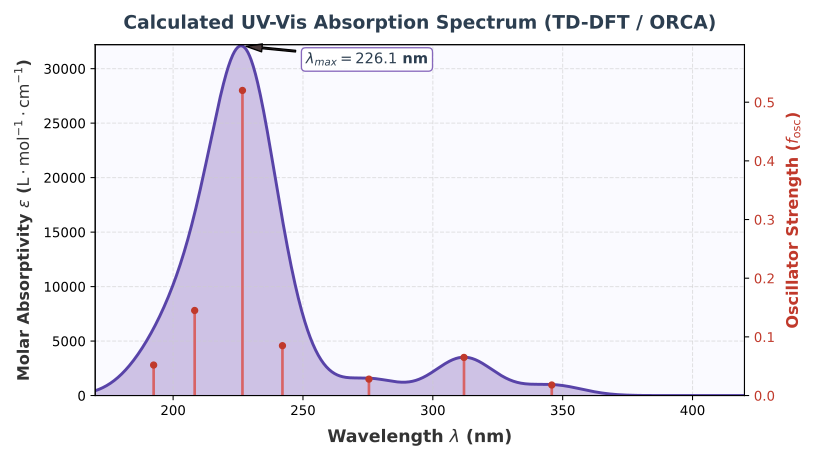
UV-Vis Spectrum (TD-DFT)
To model the electronic absorption (UV-Vis) spectrum of a molecule, we employ
Time-Dependent Density Functional Theory (TD-DFT). While standard DFT solves for the ground-state
electron density, TD-DFT investigates the linear response of the electron density to an oscillating
electric field, yielding vertical electronic excitation energies and transition probabilities.
Prerequisites:
The molecule should be first optimized in its electronic ground state (S0).
Vertical excitations are then computed from this equilibrium geometry.
Setting up the %tddft block in ORCA:
- NRoots: Specifies how many excited states (roots) to solve for. For a standard UV-Vis window, 10 to 30 roots are common.
- MaxDim: Dimension of the expansion subspace per root in the Davidson solver (typically 5 × NRoots).
- TDA: Setting TDA false performs full TD-DFT; TDA true enables the Tamm-Dancoff Approximation.
Generating the Spectrum with orca_mapspc:
ORCA provides the built-in tool orca_mapspc. Running orca_mapspc isoprene_tddft.out uv
convolutes the discrete oscillator strengths (stick spectrum) with Gaussian or Lorentzian broadening
into a continuous UV-Vis spectrum (*.abs.dat) ready for plotting.
Key TD-DFT options & spectrum tools:
%tddft ORCA block containing all electronic excitation controls.
NRoots 10 Calculates the lowest 10 singlet vertical electronic excitations.
TDA false Solves full linear-response TD-DFT equations (true for Tamm-Dancoff).
f_osc Oscillator strength: dimensionless quantity proportional to absorption intensity.
orca_mapspc file.out uv Generates convoluted UV-Vis data (.abs.dat and .abs.stk).
[emma@pople]$ vi isoprene_tddft.inp
# ORCA TD-DFT Electronic Excitation Calculation
! RKS B3LYP def2-TZVP TightSCF PAL8
%tddft
NRoots 10 # Number of excited states
MaxDim 50 # Expansion space
TDA false # Full TD-DFT
end
# Coordinates of optimized ground-state Isoprene
* xyz 0 1
C -0.2638 -0.1109 0.0000
C -1.3682 -0.8722 0.0000
C -2.6947 -0.2665 0.0000
C -3.8458 -0.9410 0.0000
C -1.2885 -2.3550 0.0000
H -0.3045 0.9856 0.0000
H 0.7449 -0.5425 0.0000
H -2.7008 0.8389 0.0000
H -3.8994 -2.0373 0.0000
H -4.8166 -0.4284 0.0000
H -0.2275 -2.7055 0.0000
H -1.7967 -2.7689 0.9064
H -1.7967 -2.7689 -0.9064
*
[emma@pople]$ /path/to/orca isoprene_tddft.inp > isoprene_tddft.out
[emma@pople]$ grep -A 15 'ABSORPTION SPECTRUM' isoprene_tddft.out
------------------------------------------------------------
State Energy (cm-1) Wavelength (nm) fosc
------------------------------------------------------------
1 44109.4 226.7 0.5200
2 48007.7 208.3 0.1450
3 51948.1 192.5 0.0520
[emma@pople]$ orca_mapspc isoprene_tddft.out uv
Mode is UV-VIS ABSORPTION SPECTRUM
Writing: isoprene_tddft.out.abs.dat (convoluted curve)
Writing: isoprene_tddft.out.abs.stk (stick spectrum)
[emma@pople]$ gnuplot -p uv_style.p
 FamaLab tutorial